

Apple has released new command line tool xccov with Xcode 9.3 for inspecting the contents of Xcode code coverage reports. Unfortunately, there isn’t any web documentation yet, so we have to type man xccov in the terminal to get more information about this command line tool. This utility requires Xcode 9.3 and command-line tools shipped with Xcode 9.3. With xccov , we can generate Xcode code coverage reports in the human-readable format as well as machine representable format like JSON without using third-party tools. In this post, we will explore how to generate and view Xcode code coverage reports using this new command line utility with demo iOS app.
Mind The Name
The command line tool xccov is native Apple developer tool shipped with Xcode 9.3. However, there are few open-source tools with similar names might confuse you.
- It’s not xcov
There is Ruby library with name xcov to generate nice looking code coverage reports which can be used with tools like Fastlane and Danger.
- It’s not hiroakit/xccov
There is another pure Swift library to generate Xcode code coverage reports which is also called xccov but written by Hiroaki ENDOH
These libraries have the similar or almost similar name with new utility launched by Apple and coincidently they are doing same job i.e generating nice code coverage reports for Xcode. With the launch of Apple’s xccov, these libraries might not be needed.
Generating Code Coverage Reports
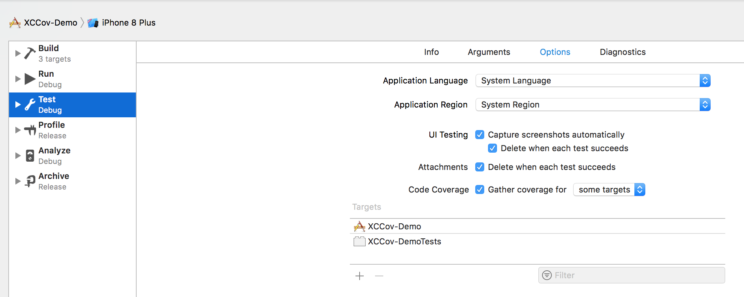
In order to explore xccov , let’s create a new iOS app with ‘Tabbed App’ template with Unit and UI Test targets and name it as ‘XCCov-Demo’. This will create Xcode project scheme `XCCov-Demo’. We can explicitly enable the code coverage for the scheme by editing the scheme and tick the box ‘Code Coverage’ from ‘Test’ action. We can filter targets as well if we don’t want to include coverage for UITests as shown below
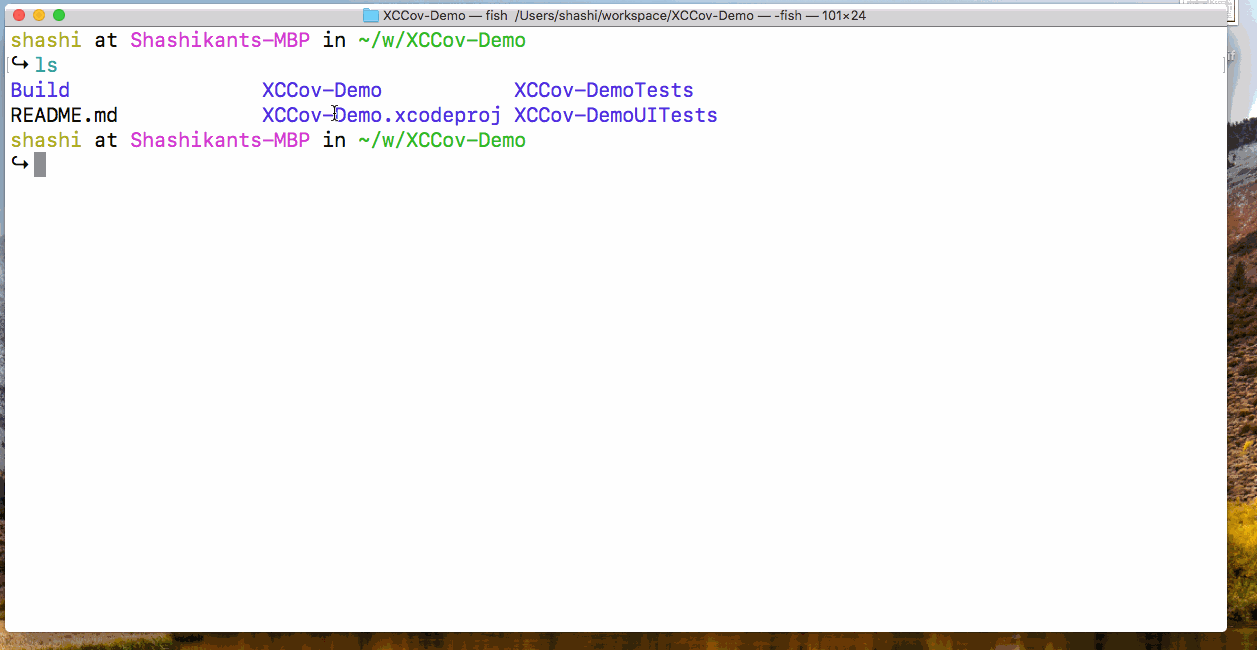
Now that, we have enabled the code coverage for our scheme. Once we build and test this scheme using CMD+U button in Xcode this will generate Code coverage reports into the default derived data directory located at ~/Library/Developer/Xcode/DerivedData and you will see the code coverage reports generated at Logs/Test directory. However, for this demo, we will generate the derived data inside our project so that we can easily look at the reports.
Let’s build and Test our app using the xcodebuild using the following command from the root of the project
|
1 |
$ xcodebuild -project XCCov-Demo.xcodeproj/ -scheme XCCov-Demo -derivedDataPath Build/ -destination 'platform=iOS Simulator,OS=11.3,name=iPhone 7' -enableCodeCoverage YES clean build test CODE_SIGN_IDENTITY="" CODE_SIGNING_REQUIRED=NO |
This will dump all the DerivedData inside the Build directory.
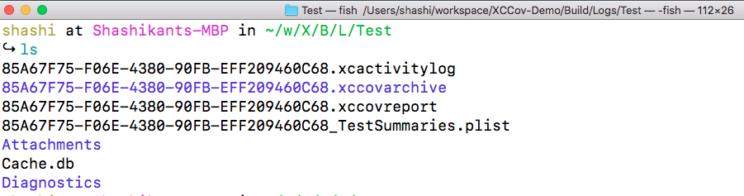
This will generate the code coverage data at path Build/Logs/Test. We will see code coverage with .xccovreport and .xccovarchive extension.
What’s Inside Coverage Report
Inside the Logs/Test directory, there is coverage report, with extension .xccovreport , and the coverage archive, with extension .xccovarchive respectively. As per man page of this utility “The coverage report contains line coverage percentages for each target, source file, and function/method that has coverage information. The coverage archive contains the raw execution counts for each file in the report”. However, they are not human readable files that’s the reason we need xccov to look inside these files and display the reports in the nice format.
Viewing Code Coverage Reports
Now that, we have generated code coverage logs and we can use xccov to view the code coverage in human-readable format. In order to access xccov we have put it inside the $PATH or we can easily access it with xcrun command line utility without hassle. We can achieve following things with xccov at the moment
- View the Code Coverage Reports from Terminal
- Spit out the JSON from code coverage reports.
- List all the files for which code coverage has been generated
- Look at the code coverage report for one specific file.
Let’s explore the commands to achieve these using xccov
View Report -Default
We can view code coverage reports in the default format which isn’t particularly great but as per the Apple, it’s human readable. In our demo project, we can generate the report using the following command
|
1 |
$ xcrun xccov view Build/Logs/Test/*.xccovreport |
View Report- JSON
The real power of the xccov comes when it can generate the code coverage reports in the JSON format. As per Apple’s documentation on the man page, its machine representable format. We can hook these JSON results anywhere we like or build another tool on top of this. We can generate JSON reports using the following command
|
1 |
$ xcrun xccov view Build/Logs/Test/*.xccovreport --json |
We have just added the flag --json at the end of the command to get the JSON reports.
List All The Files
We can also list all the files that have code coverage data.
|
1 |
$ xcrun xccov view --file-list Build/Logs/Test/*.xccovarchive/ |
This will display all the project files with absolute path.
Code Coverage for Specific File
We can also code coverage for the specific file which displays line by line report in some sort of symbols. Not sure how useful that would be but its there.
|
1 |
$ xcrun xccov view --file ~/Desktop/XCCov-Demo/XCCov-Demo/AppDelegate.swift Build/Logs/Test/*.xccovarchive/ |
We have to give full path of the file and you will get reports in symbols.
Watch It in Action
Watch the GIF containing features of xccov
Source Code
There is source code with fully instructed README file available on Github XCCov-Demo. Feel free to check out the project and try it yourself.
Conclusion
With Xcode 9.3, Apple shipped xccov to reduce the pain of using third-party tools to display the Xcode code coverage reports in the nice format. The default format doesn’t look great and usable at the moment but the real power comes when it generate JSON. Using JSON format, we can able to hook these reports on Continuous Integration Servers.